Paste your ranking data
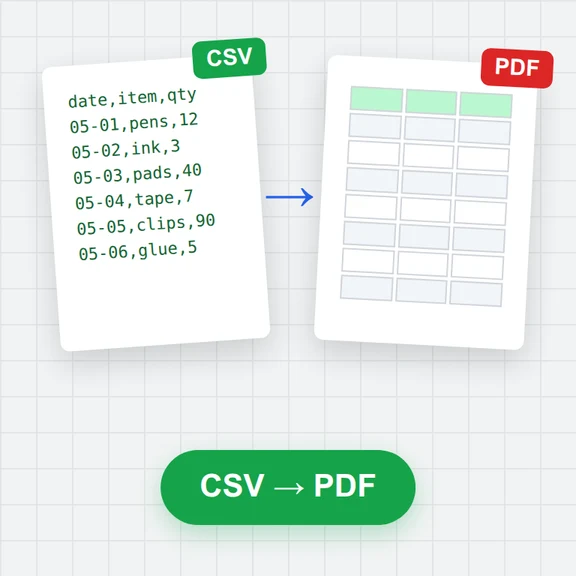
One column of weeks, months or years and one column per player, product or team, or open a CSV.
Paste scores, sales or votes over time and turn them into a racing bar ranking.
Add a title and music, then download a vertical or wide MP4.
Loading the bar chart race maker…
One column of weeks, months or years and one column per player, product or team, or open a CSV.
Choose how many places to show, colours, the number style and how fast the ranking moves.
Export an MP4 in 9:16, 1:1 or 16:9 with your own music.
Create thumbnails, intros and background art from a prompt with WaveSpeed AI.
Make a thumbnail or cover image for your ranking video.
Turn a prompt into an intro clip for your chart.
Turn a picture into a 3D model.
$1 in free credits for eligible new accounts. No card needed. Generators have separate account and credit requirements. The bar chart race maker is free.
An animated chart where bars grow and swap places as values change over time, so viewers watch the leader change.
Numbers for each item at several points in time: weeks, months, years or dates. Totals so far (like season points) make the most exciting races.
Yes. Choose from 3 to 20 bars; items climb in from below and drop out as they lose places.
Yes: no sign-up, no watermark, and your data never leaves your browser.
Top-10 animation · Paste from a spreadsheet · MP4 with music