Add your data
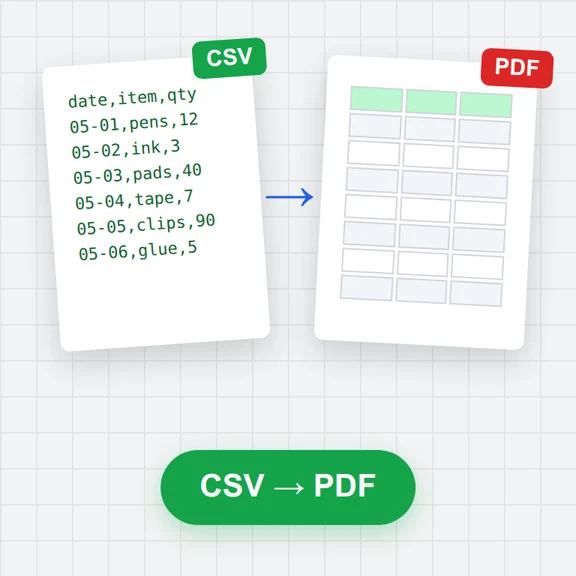
Paste a table from a spreadsheet, open a CSV file or start from an example. Dates or years can run down the rows or across the top.
Paste a table or open a CSV and watch your data race: bars grow, overtake and climb the ranking.
Style it, add your music and download an MP4 for any screen.
Loading the bar chart race maker…
Paste a table from a spreadsheet, open a CSV file or start from an example. Dates or years can run down the rows or across the top.
Set the title, colours, number of bars, number format and speed. Add a music track if you like. The preview plays as you change things.
Pick 9:16, 1:1 or 16:9, the resolution and frame rate, and download an MP4 ready to post.
Good data and pacing matter more than effects.
The top 10 is easy to follow on a phone. More bars work in 16:9 for bigger screens.
About one second per year suits most races. Set the total length to fit a short clip of under a minute.
Add a category column (like region or genre) and bars of the same group share a colour.
Use the compact style (1.2M) for big values and put units in the subtitle or the suffix.
Missing values between two periods are filled in smoothly, and items that start or stop grow in and drop out.
A pause of two or three seconds at the end lets viewers read the final ranking.
Create thumbnails, intros and background art from a prompt with WaveSpeed AI.
Make a thumbnail or cover image for your ranking video.
Turn a prompt into an intro clip for your chart.
Turn a picture into a 3D model.
$1 in free credits for eligible new accounts. No card needed. Generators have separate account and credit requirements. The bar chart race maker is free.
Yes. No account, no watermark and no limits. The chart and the video are made in your browser.
Any table with periods (years, months, dates or names like Week 1) and numbers. Paste it from a spreadsheet or open a CSV or TSV file. Periods can run down the first column, across the top row, or the table can have one row per period, name and value.
Add a column called Category, Group, Region or Type. Bars in the same group get the same colour, and you can switch between five palettes.
MP4 with H.264 and AAC, or WebM with VP9 and Opus, at 1080p, 720p or 540p and 30 or 60 frames per second, in vertical 9:16, square 1:1 or wide 16:9.
Yes. Choose an audio file from your device, pick where it starts, loop it if the race is longer and fade it out at the end. It is mixed into the video file.
As long as your data needs. Set the time per period or type the total length you want, and add a pause at the start and the end.
Turn on flags and items named after countries, in English or your language, or two-letter country codes get their flag emoji next to the name.
No. Your table and music are read by your browser, and the video is made on your device and saved to your downloads.
Free, no sign-up, no watermark.
/filters:quality(82)/media/images/1791123751656780930_IfFPY7R0.webp)
/filters:quality(82)/media/images/1791123737177812425_RjKT3cku.webp)
/filters:quality(82)/media/images/1791123748309870128_xlkNgK8N.webp)
/filters:quality(82)/media/images/1791123738630744263_oR09R0aj.webp)
/filters:quality(82)/media/images/1791177033162457776_uQ09OY7g.webp)
/filters:quality(82)/media/images/1791123734319125607_JdnwGPY7.webp)
/filters:quality(82)/media/images/1791123746355630206_udnxGPY7.webp)
/filters:quality(82)/media/images/1791123744771362580_yC0sPezZ.webp)
/filters:quality(82)/media/images/1791123738606970169_5KIR1ais.webp)
/filters:quality(82)/media/images/1791123748197655725_EUmuFNW6.webp)