Open your files
Drop CSV, Excel, JSON, Parquet or SQLite files, or paste cells copied from a spreadsheet. Each file (or sheet, or database table) becomes a table, with its columns profiled.
Open CSV, Excel, JSON, Parquet and SQLite files with millions of rows. See every column’s type and range, then sort, filter, group, pivot and chart without writing code.
Or write SQL. Save any result as CSV, Excel, Parquet or JSON.
Loading the data explorer…
Drop CSV, Excel, JSON, Parquet or SQLite files, or paste cells copied from a spreadsheet. Each file (or sheet, or database table) becomes a table, with its columns profiled.
Click headers to sort, type in the filter row, group and pivot with the builder, or write SQL. Switch any result to a chart.
Download what you see — filters and sort included — as CSV, Excel, Parquet or JSON, or the chart as PNG or SVG.
CSV and TSV with the separator, header and types detected, Excel workbooks (every sheet), JSON arrays and JSON lines, Parquet and SQLite databases. Several files at once.
Each column’s type, how many cells are empty, roughly how many distinct values it has, and its lowest and highest value.
Scroll through millions of rows smoothly. Sort by one or several columns, filter each column (contains, =, >, ranges, dates by year or month) and search every column at once.
Pick rows, an optional column field and values (sum, average, count, distinct count, min, max, median). Dates group by year, quarter, month, week or day. Subtotals on request. The SQL it writes is one click away.
A full analytical SQL engine: joins across your files, window functions, CTEs, PIVOT. Ctrl+Enter runs, errors are shown as they come, and your recent queries are kept.
Bar, line, area, scatter, pie and histogram from any result, saved as PNG or SVG. Results download as CSV, Excel, Parquet or JSON.
Open both, then in SQL write: SELECT * FROM orders JOIN customers USING (customer_id). Table names come from the file names.
In a filter box: >1000, 10..20, !=0, =Europe (exact), !test (excludes), ^North (starts with), 2024-03 (that month), a|b (either). A lone = finds empty cells.
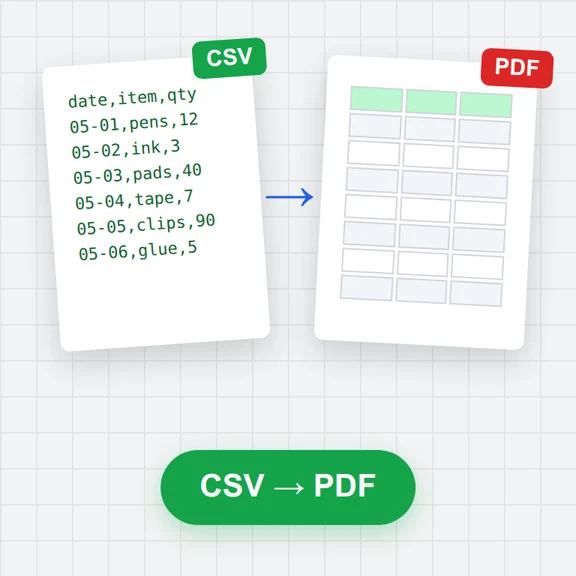
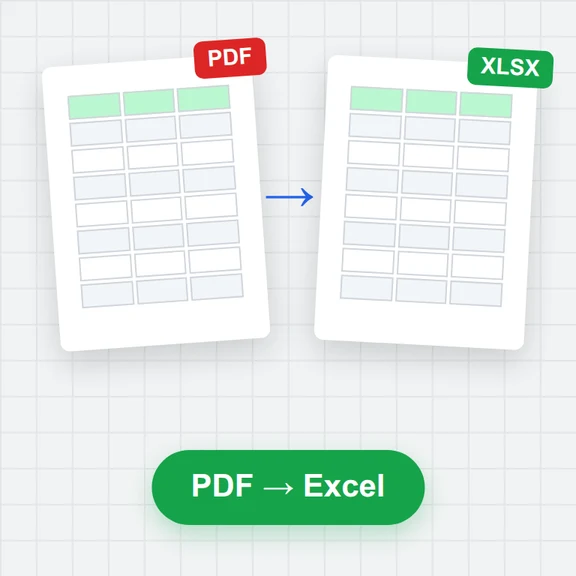
Open a file and download it in another format: CSV to Excel, JSON to CSV, Parquet to CSV, Excel to Parquet. Filters and sort apply to the download.
Charts draw up to 5,000 points. For long data, group it first (for example revenue by month) and chart that result.
Turn your findings into images and video with WaveSpeed AI.
Make cover images and illustrations for reports and slides.
Turn a still into a short explainer clip.
Turn a picture into a 3D model.
$1 in free credits for eligible new accounts. No card needed. Generators have separate account and credit requirements. The data explorer is free.
Yes. No account, no row limit set by us, no watermark and no paid tier.
No. Files are read and queried by an analytical database engine running inside your browser tab. The page downloads the engine once (about 7 MB); your data never leaves your device.
There is no limit set by us: your device’s memory decides. On our test computer a 150 MB CSV with 1 million rows opened in about 3 seconds and a group by over it took 0.2 seconds; a 1.2 GB CSV with 8 million rows opened in about 15 seconds, and a 300,000-row Excel file in about 2. A browser tab gives the engine at most about 4 GB, so CSV, Excel or JSON files of several GB will not fit; Parquet is read on demand, so larger Parquet files can still be browsed and summarised. Phones and older laptops are slower and have less memory.
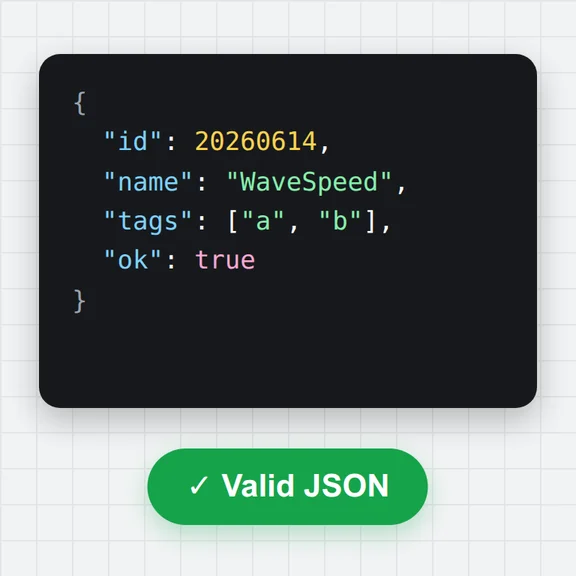
CSV and TSV (any separator), Excel .xlsx and .xls (every sheet), JSON arrays, JSON lines (.ndjson, .jsonl), Parquet and SQLite (.sqlite, .db). You can also paste cells copied from a spreadsheet.
Yes. Every file, sheet or database table you open is a table. Join, union or compare them in SQL, for example SELECT * FROM sales JOIN targets USING (region).
A complete analytical SQL dialect (it is the same as DuckDB’s): joins, GROUP BY with ROLLUP, window functions, CTEs, PIVOT and UNPIVOT, regular expressions, date functions and more. Tables you create in SQL appear in the table list.
Your SQL and query history are kept in this browser. The data itself is not stored: after a reload, open your files again. Download results you want to keep.
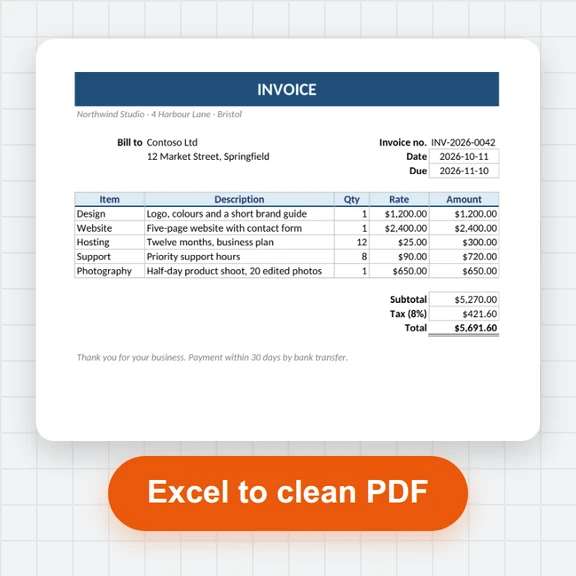
It is a single-user analysis tool, not a dashboard server: there are no scheduled refreshes, live database connections, shared dashboards or formulas that recalculate like a spreadsheet. Charts draw up to 5,000 points; summarise bigger data first. Excel files lose their formatting, formulas (values are kept) and charts when opened.
Free, private and fast — nothing to install.
/filters:quality(82)/media/images/1791123751656780930_IfFPY7R0.webp)
/filters:quality(82)/media/images/1791123737177812425_RjKT3cku.webp)
/filters:quality(82)/media/images/1791123748309870128_xlkNgK8N.webp)
/filters:quality(82)/media/images/1791123738630744263_oR09R0aj.webp)
/filters:quality(82)/media/images/1791177033162457776_uQ09OY7g.webp)
/filters:quality(82)/media/images/1791123734319125607_JdnwGPY7.webp)
/filters:quality(82)/media/images/1791123746355630206_udnxGPY7.webp)
/filters:quality(82)/media/images/1791123744771362580_yC0sPezZ.webp)
/filters:quality(82)/media/images/1791123738606970169_5KIR1ais.webp)
/filters:quality(82)/media/images/1791123748197655725_EUmuFNW6.webp)