Open the chart
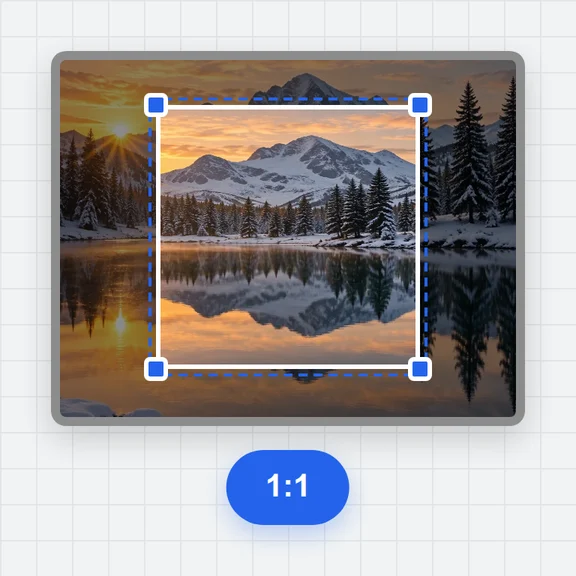
Drop an image, paste a screenshot, or open a PDF and pick the page. Crop to the figure if the page holds more than one.
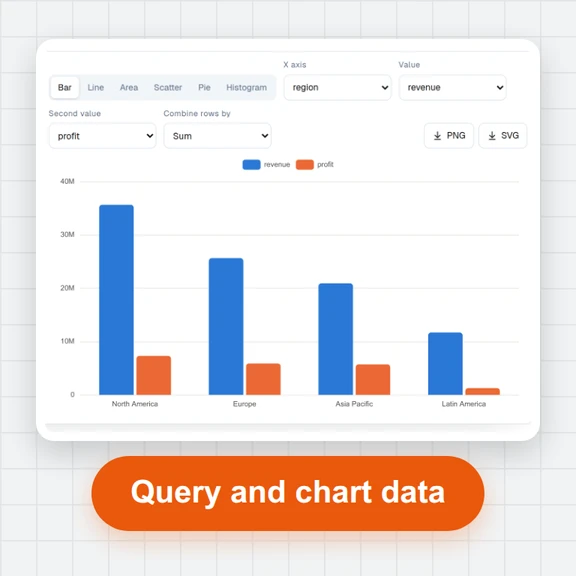
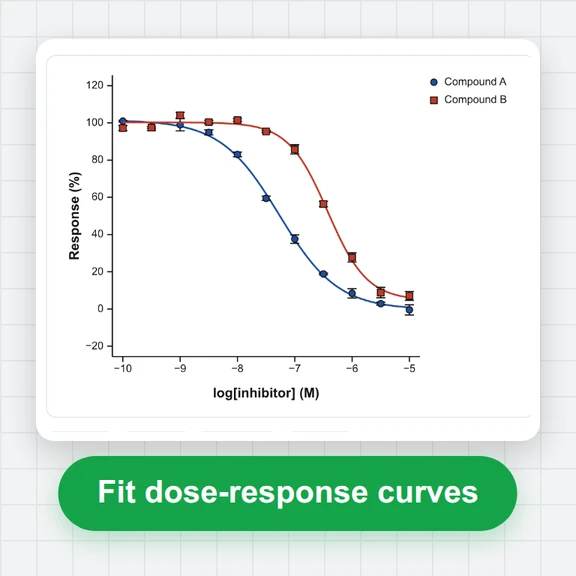
Open a chart from a paper, a datasheet or a screenshot, set two points on each axis, and capture its data.
Click points by hand or let it find lines, markers and bars by colour, then export a table.
An image, a screenshot from the clipboard, or a page of a PDF.
PNG, JPG, WebP, GIF, BMP or PDF · or paste a screenshot · or a saved project (.json)Drop an image, paste a screenshot, or open a PDF and pick the page. Crop to the figure if the page holds more than one.
Choose the chart type, click two known points on each axis and type their values. Log, date and polar axes are supported.
Click points by hand or pick the line colour and let it find them. Check the table and download CSV, Excel or JSON.
Linear, logarithmic (base 10) and date axes, in any combination. Scans that are rotated or skewed are handled because the calibration follows the axes, not the page.
Pick a line or marker colour, set a tolerance and, if needed, paint the area to search. Lines are sampled at even X steps or along the curve; markers are found by size, and touching ones are split.
Bar heights are read automatically along the value axis, negative bars included. Polar charts take degrees or radians in either direction; ternary diagrams give the three fractions.
A magnifier follows the pointer, points can be dragged or nudged with the arrow keys by a pixel or a tenth of one, and every change can be undone.
Turn on the calibrated grid to see the axes you defined drawn over the picture, and see your points joined as a line on top of the original.
The project is saved in your browser as you go, and can be saved as a file with the picture, axes and points to reopen later.
Create figures, cover images and explainer clips for papers, posters and talks with WaveSpeed AI.
Make an illustration or a graphical abstract from a prompt.
Turn a still figure into a short animated clip for a talk.
Turn a sketch or photo of an object into a 3D model.
$1 in free credits for eligible new accounts. No card needed. Generators have separate account and credit requirements. The plot digitizer is free.
Yes. There is no account, no watermark and no limit on charts or points. Pictures larger than 30 megapixels are scaled down to 30 megapixels.
No. The picture is read and measured in your browser tab. Opening a PDF downloads the PDF reader's font files to your browser, but your file and data are never sent anywhere.
As accurate as the picture: positions are measured to a fraction of a pixel. On test charts with known data, automatic extraction was off by about a tenth of a pixel on average for lines and markers, and under half a pixel for bar ends. Most of the error in real use comes from where the axis points are clicked, so zoom in and use the magnifier when you set them.
Choose Log for that axis and click two labelled ticks on it, such as 10 and 1000. Values between them are then read on the log scale. Log axes can't include zero or negative values.
No. Click the axis points where they are on the picture: lines of equal X are taken parallel to the Y axis and vice versa, so rotation and skew are corrected. For warped scans choose "3+ points" and click several points whose X and Y you know; they are fitted together.
It finds the pixels close to the colour you pick, inside the area you paint if you paint one. For lines it takes one point per X step (fitting the line locally so slopes aren't biased) or per column window; for scatter plots it finds each marker's centre; for bar charts it measures each bar's end along the value axis. Gridlines and text of the same colour can be kept out by painting the area to search.
Yes. Open the PDF, pick the page and a resolution (300 dpi suits most figures), then crop to the chart. Vector charts in PDFs come out sharp at any resolution.
It doesn't read numbers from text (axis labels are typed in by you), it doesn't separate lines of the same colour that cross, and it doesn't open SVG or EPS files. Stacked bars are read one colour at a time, each from its own baseline.
Free, private and nothing to install.
/filters:quality(82)/media/images/1791123751656780930_IfFPY7R0.webp)
/filters:quality(82)/media/images/1791123737177812425_RjKT3cku.webp)
/filters:quality(82)/media/images/1791123748309870128_xlkNgK8N.webp)
/filters:quality(82)/media/images/1791123738630744263_oR09R0aj.webp)
/filters:quality(82)/media/images/1791177033162457776_uQ09OY7g.webp)
/filters:quality(82)/media/images/1791123734319125607_JdnwGPY7.webp)
/filters:quality(82)/media/images/1791123746355630206_udnxGPY7.webp)
/filters:quality(82)/media/images/1791123744771362580_yC0sPezZ.webp)
/filters:quality(82)/media/images/1791123738606970169_5KIR1ais.webp)
/filters:quality(82)/media/images/1791123748197655725_EUmuFNW6.webp)