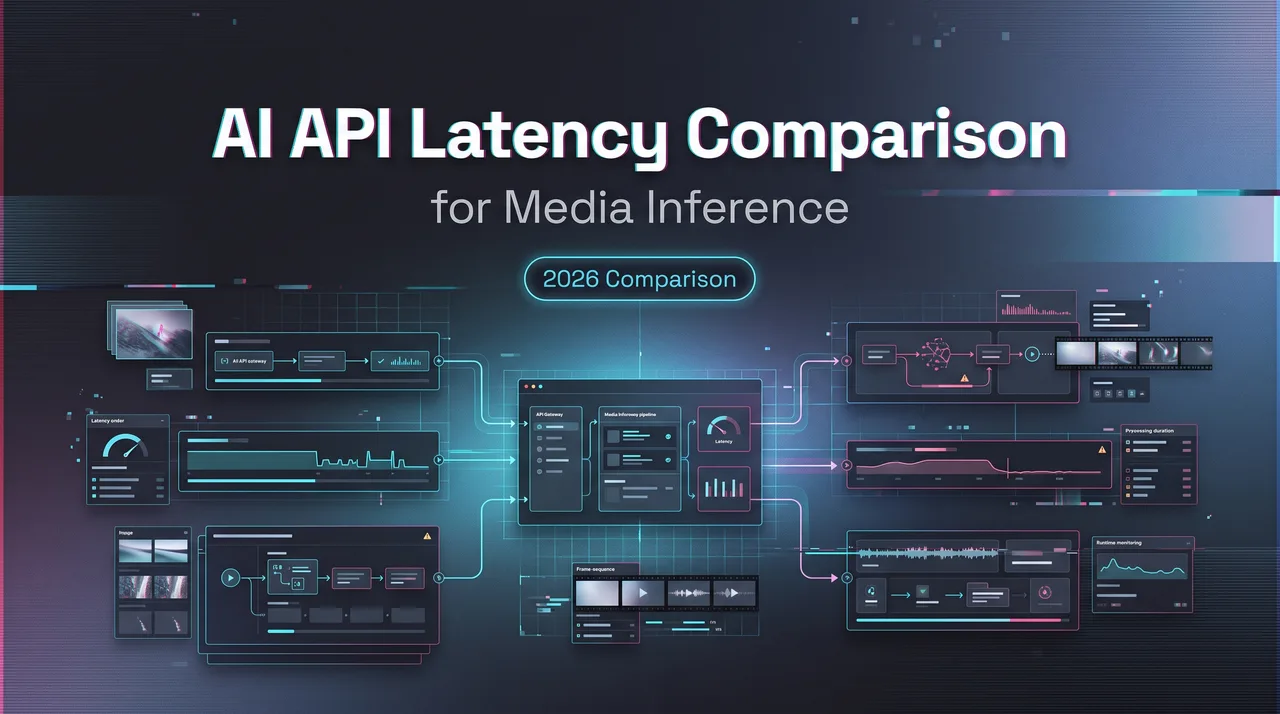
AI API Latency Comparison for Media Inference
AI API latency comparison for media inference teams measuring response time, queue delay, throughput, and user experience.
Hello, I’m Dora. I started this AI API note on latency after a video job looked fine in provider logs and still felt broken in the product. The request returned. The job queued. The output rendered. Then the asset failed review because the motion stuttered halfway through. The dashboard called it success. The user called it waiting.
That gap is the whole problem.
For media inference, latency is not just the time between POST /generate and 200 OK. It is the time between intent and a usable asset. If the image arrives in six seconds but needs three retries, it was not a six-second generation. If the video starts in a queue instantly but finishes two minutes later, time-to-first-response did not save the workflow. Speed isn’t the goal. Not breaking flow is.
This is a practical model API comparison framework for teams building image, video, audio, and mixed media features. I would use it before switching providers, changing model routes, or publishing any latency claim to users.
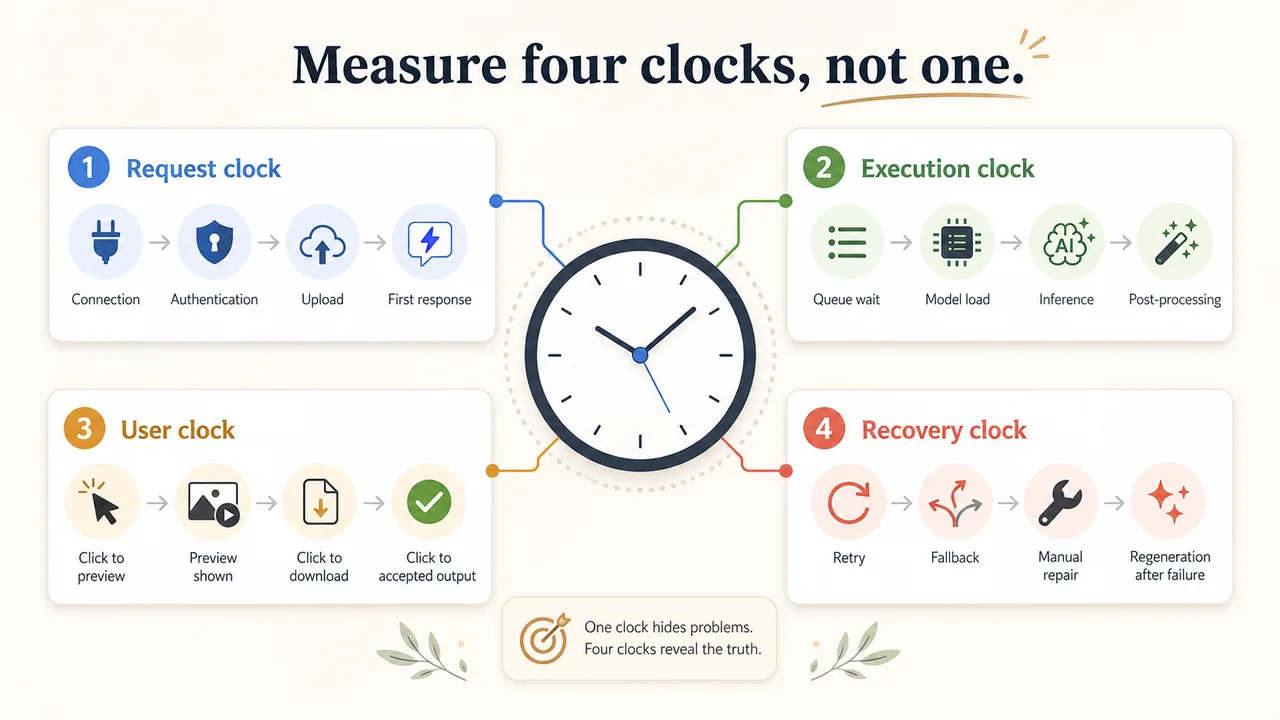
Quick answer: measure four clocks, not one.
- Request clock: connection, authentication, upload, first response.
- Execution clock: queue wait, model load, inference, post-processing.
- User clock: click to preview, click to downloadable result, click to accepted output.
- Recovery clock: retry, fallback, manual repair, and regeneration after failure.
Only the last two tell me whether the system feels usable.
Why AI API Latency Is Not One Number
TTFB, total generation time, queue delay, and post-processing
Time to first byte matters. I still track it. It tells me whether the API endpoint is reachable, whether auth is passing, and whether the service can acknowledge work quickly.
But TTFB becomes misleading when the work is asynchronous. A provider can return a job ID in 300 milliseconds and still make the user wait 90 seconds for the actual output. That is not bad by itself. Async media generation is normal. The mistake is treating the fast acknowledgment as the user-facing result.
I split media inference latency into these pieces:
| Latency piece | What it measures | Why it matters |
|---|---|---|
| TTFB | Request sent to first byte or job ID | Detects API reachability and request overhead |
| Queue delay | Job accepted to compute start | Shows capacity pressure and region fit |
| Model load | Compute slot ready to model execution | Exposes cold starts and rare-model penalty |
| Inference time | Model execution to raw output | Captures model, hardware, size, and duration cost |
| Post-processing | Safety checks, encoding, upscaling, storage, webhook | Explains why “done” is not always downloadable |
| Accepted-output latency | User action to usable approved asset | The only number product teams can actually feel |
I paused here during one internal test because the provider log had three timestamps and none of them matched the product complaint. The missing piece was post-processing. The model finished quickly. The output URL took much longer to become available because the file had to be encoded, scanned, pushed to object storage, and returned through a webhook path.
That is why I do not use one latency column in a provider comparison sheet anymore.
For synchronous image calls, TTFB and total response time may be close enough to discuss together. “For many streamed LLM interfaces, TTFB is often used as one proxy for perceived responsiveness. For image and video generation, the useful unit is usually a complete file, a preview frame, or an accepted asset. The first byte is not enough.
Instrumentation also matters. If the server can expose named backend timing phases, standards such as Server-Timing give a clean way to separate backend work from the browser or client-side view. I do not need every internal detail in public logs. I do need enough labels to tell queue wait from generation time. Otherwise, every incident turns into guessing with nicer charts.
Why image, video, and LLM latency behave differently
LLM latency usually has two user-facing layers: first token and full answer. If the first token arrives quickly, a longer completion can still feel acceptable. The interface has something to show.
Image generation is different. A user rarely benefits from one pixel arriving early. Some systems support partial images or previews, but the decision point is still the final asset. If the model needs higher quality, larger dimensions, reference images, or editing masks, the latency shape changes. OpenAI’s image generation docs are a useful reminder that size, quality, file format, compression, and image inputs all affect the request surface. Bigger is not just bigger. It is more work.
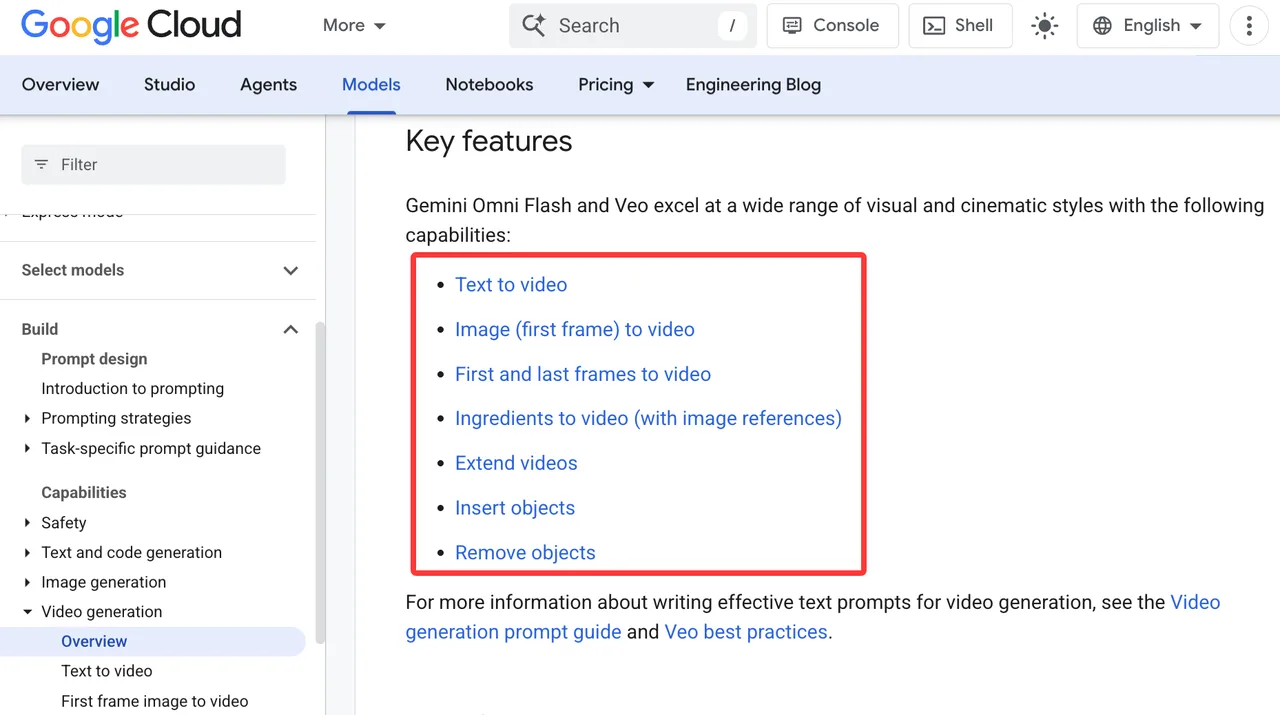
Video generation is worse, in a very plain way. A five-second clip is not five seconds of work. It can mean prompt planning, frame generation, temporal consistency checks, audio alignment, safety review, encoding, and delivery. Image-to-video adds reference handling. Editing adds even more state. Google’s video generation docs show the range of modes teams now need to account for: text-to-video, first-frame image-to-video, first-and-last-frame, reference ingredients, extension, object insertion, and object removal.
That variety is good for builders. It is bad for lazy latency math. A fair comparison does not put LLM chat, text-to-image, and text-to-video in one row and call the fastest one “best.” The workloads do not have the same output unit. The right comparison is per accepted unit: one usable answer, one usable image, one usable clip, one accepted edit.
Comparing Media Inference Latency
Cold starts, region, payload size, resolution, duration
I start every provider test with boring controls. Same region. Same payload class. Same output size. Same retry policy. Same timeout. Same time window. Boring is good here. Boring keeps the argument short.
- Cold starts are the first variable I isolate. A popular model may already be warm. A less common model may need to load onto GPU memory before execution. Custom weights, adapters, or rare model routes can add a penalty that does not show up during the provider’s public demo. Cold starts are invisible to low-frequency users. Intolerable for high-frequency ones.
- Region is the second variable. A 200 millisecond network difference does not matter much for a 90-second video job. It matters a lot for interactive editing, thumbnail iteration, voice preview, moderation loops, and any flow that calls several models in sequence. Region also affects upload time when users send large reference assets.
- Payload size is the third variable. Text prompts are cheap to transmit. Reference images, masks, source videos, and audio files are not. A workflow that uses three input images for character consistency will not behave like a simple text-to-image prompt. A video edit with a 20 MB input clip will not behave like a text-only request.
- Resolution and duration are the fourth variable. They change compute time, output file size, post-processing, transfer time, and sometimes moderation behavior. I do not compare a square draft image against a high-quality portrait image and pretend the provider changed. The job changed.
- The fifth variable is concurrency. Single-request tests are useful for smoke checks. They are not production tests. A media product often fails under bursts: a campaign launch, a classroom starting at the same time, a creator batch exporting 80 assets, or an internal team running scheduled jobs at the top of the hour. The provider that looks fine at one request per minute may look different at 40 concurrent sessions.
Here is the test grid I use before trusting a number:
| Test dimension | Minimum split | What I record |
|---|---|---|
| Modality | Image, video, audio, LLM assist | Output type and accepted unit |
| Workload | Draft, edit, final render | Prompt, inputs, model ID, parameters |
| Region | User region and inference region | Network time, upload time, queue time |
| Load | Single, burst, sustained | P50, P95, timeout, retry count |
| Output | Size, quality, duration, format | Generation time and post-processing time |
| Recovery | Retry and fallback path | Repair time and accepted-output latency |
This table is intentionally plain. A fancy benchmark with missing payload details is less useful than a dull spreadsheet that can be rerun next month.
P50, P95, timeout rate, and accepted-output latency
- P50 is the median. It tells me what a normal request feels like. Product teams like it because it gives a clean mental picture. Half the requests are faster. Half are slower.
- P95 is where support tickets start to smell different. It shows the slow requests that still happen often enough to matter. In media inference, the P95 may be the difference between “this feels okay” and “I opened another tab and forgot what I was doing.” Found the pattern on the third try.
- Timeout rate is separate. A slow success and a timeout failure do not create the same product cost. A timeout can trigger duplicate billing, a confused retry, a half-created asset, or a user who clicks generate again. If the backend continues running after the client times out, finance will care. So will support.
Accepted-output latency is the number I trust most. It measures from user action to usable result. Usable means the file loaded, passed required checks, matched enough of the prompt, and did not require immediate regeneration.
That last clause matters. A provider can be fast and still expensive if low-quality outputs force retries. A slow provider can still be cheaper if it produces a usable clip on the first attempt. Latency and quality are not separate in production. They bill together.
For SLOs, I prefer two layers:
- API SLO: request acknowledgment, error rate, webhook delivery, timeout rate.
- Product SLO: click-to-preview, click-to-download, click-to-accepted-output.
The API SLO belongs mostly to infrastructure. The product SLO belongs to the user experience. Both need owners. Neither replaces the other.
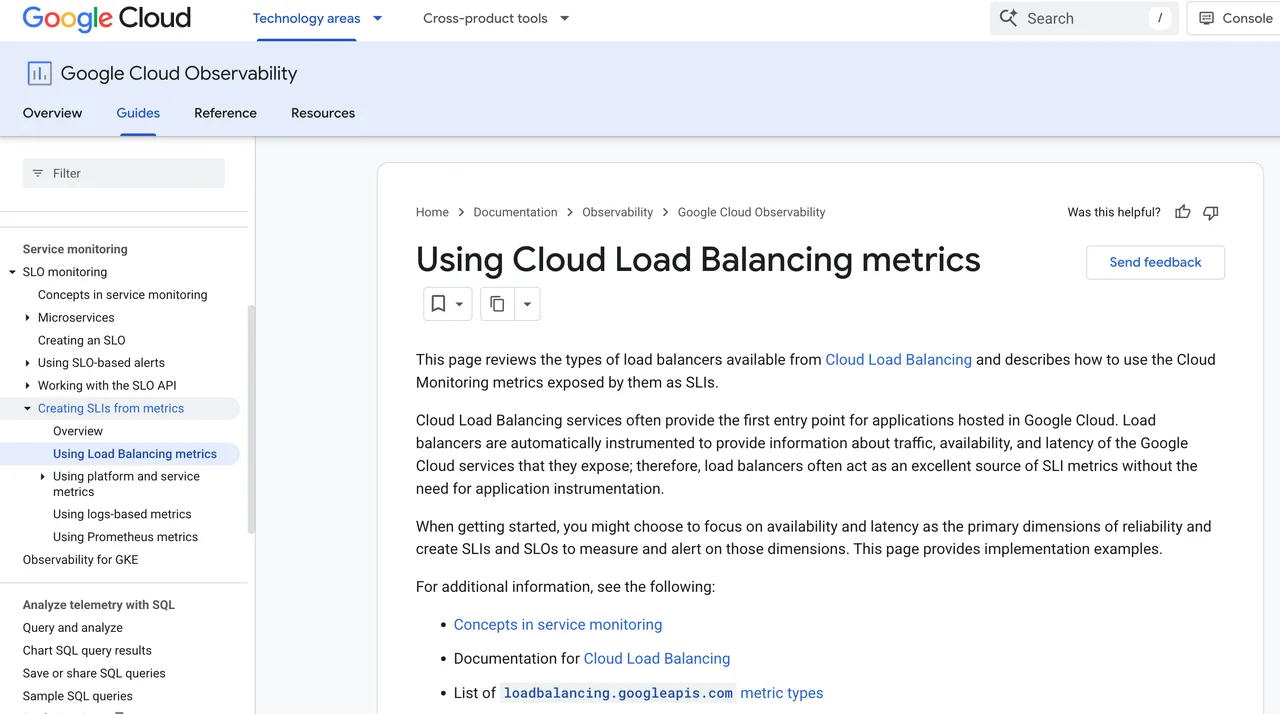
Google Cloud’s latency SLI and SLO docs make a useful distinction between request-based and window-based latency objectives. For media generation, I would keep that distinction visible. A one-minute window with terrible video queue time can damage a live launch even if the daily average looks harmless.
The comparison report should include a date. This sounds petty until a model update lands on Tuesday and half the numbers change by Friday. This conclusion has an expiration date.
A clean latency report includes:
- Test date and time window.
- Client region and inference region.
- Provider, endpoint, and model ID.
- Prompt category and safety category.
- Input file size and count.
- Output size, quality, duration, and format.
- P50, P90, P95, and timeout rate.
- Retry count and fallback count.
- Accepted-output rate.
- Accepted-output latency.
If a provider cannot give enough timestamps to separate queue, generation, and delivery, I mark the result yellow. Not red. Yellow. It may still work, but it will be harder to debug under pressure.
Reducing Latency in Production
Caching, async jobs, fallbacks, and region routing
The fastest request is the one I do not send. That is where caching starts.
I do not mean caching random generated assets and serving them as if they were fresh. That breaks user trust fast. I mean caching the parts of the workflow that are actually repeatable: prompt templates, reference assets, safety decisions when allowed, model metadata, style presets, signed upload state, and result thumbnails. For repeated catalog work, the cache may sit around inputs and previews rather than final files.
Async jobs are the default for long media tasks. Blocking an HTTP request while a video renders is a good way to create fake failures. The client times out, the backend keeps working, the user retries, and now there are two jobs doing one job’s job. Very productive, in the worst sense.
I prefer a job state model with explicit phases:
acceptedqueuedrunningpost_processingreview_requiredcompletedfailed_retryablefailed_finalcancelled
These states are not just backend decoration. They shape the UI. They also keep support from reading raw logs while a customer is waiting.
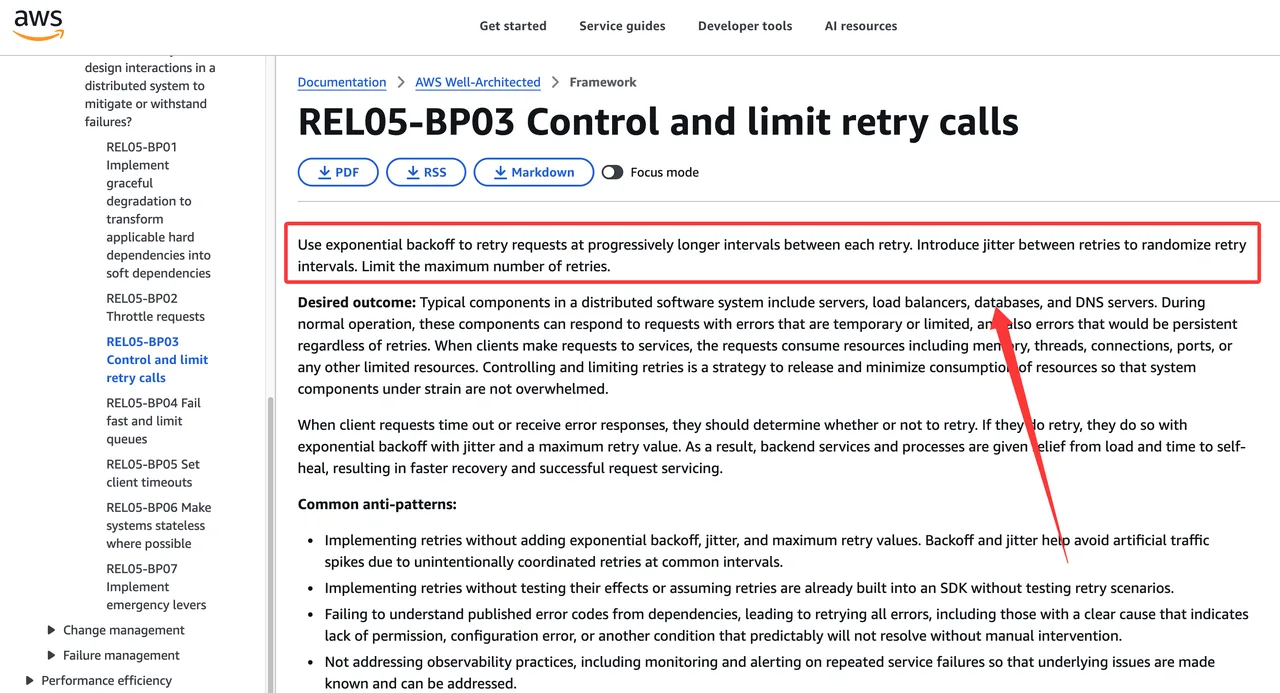
Retries need limits. A retry can hide a temporary network issue. It can also turn a small provider incident into a traffic amplifier. AWS’s guidance on retry limits is a useful baseline: make retry behavior intentional, test it, and do not let retries run wild. In media inference, I add one more rule: every retry must carry an idempotency key or a job identity that prevents duplicate paid work where the provider supports it.
Fallbacks help when the product can accept a different model or provider. They are not free. A fallback may change style, quality, safety behavior, output dimensions, prompt interpretation, or cost. That means fallback needs a routing policy, not just a panic button.
I group fallback routes by job class:
- Draft route: fastest acceptable model, lower quality allowed.
- Standard route: normal production quality and predictable cost.
- Premium route: slower or more expensive model for hero assets.
- Recovery route: provider outage, quota exhaustion, or repeated timeout.
Region routing is similar. Route users to the nearest reliable region when output quality and compliance permit it. Keep a manual override for incidents. Keep a data residency rule for restricted customers. Do not route sensitive workloads across regions just because a graph looks prettier.
The win is not always lower average latency. Sometimes the win is fewer terrible tails.
UX patterns for long-running media generation
Users will wait for media generation when the waiting feels legible. They get angry when the system acts as if nothing is happening.
I use four UX rules for long-running media jobs.
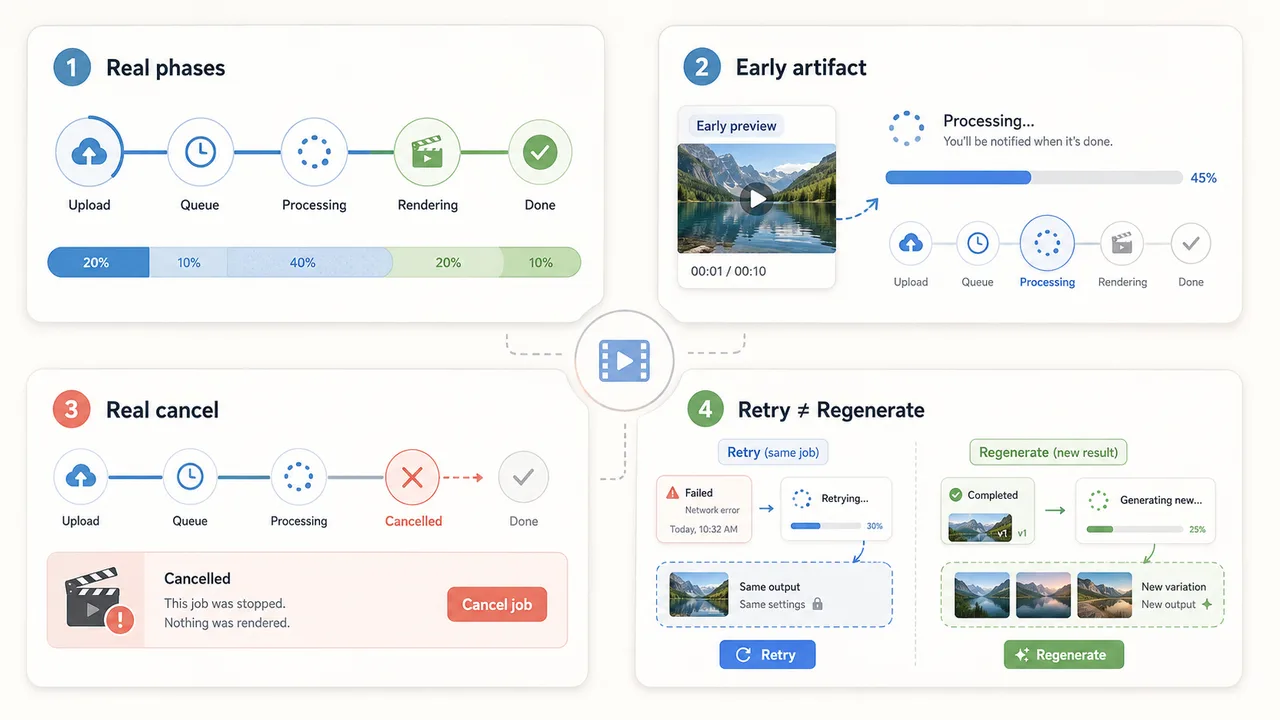
- First, show real phases. “Generating” is not enough for a 90-second video. “Queued,” “rendering,” “encoding,” and “finalizing” tell the user the system has not forgotten them. The labels should map to backend states. Fake progress bars age badly.
- Second, show a useful early artifact when possible. For images, that can be a low-quality preview. For video, it can be a keyframe, storyboard frame, or first preview after the model produces enough signal. A preview does not need to be final. It needs to confirm that the request is on the right track.
- Third, make cancellation real. If the user cancels after two seconds, the backend should try to stop work before it burns the full job cost. If the provider cannot cancel running jobs, the UI should say what cancellation means: hide result, stop polling, or prevent download. Those are different.
- Fourth, separate retry from regenerate. Retry means “same request failed; try again.” Regenerate means “make a new creative attempt.” Product UI often mixes them. Finance notices later.
For image API latency, the best UX pattern is usually fast draft, then final render. Users can choose direction before paying the latency cost of the final asset. For video API latency, the best pattern is often async submission with notification, preview checkpoints, and saved job state. For LLM-assisted media workflows, the LLM can stay synchronous while image or video jobs run async.
This is where model API comparison becomes product design. A provider with slightly slower median latency can still win if its job state, webhook reliability, cancellation behavior, and fallback compatibility reduce user confusion. A provider with fast demos can still lose if every failure becomes a manual support thread.
FAQ
Who owns latency SLOs across product and infrastructure?
Infrastructure owns the API-facing SLOs: request success, timeout rate, job-state delivery, webhook delay, queue visibility, retry behavior, and provider incident detection. Product owns the user-facing SLOs: time to preview, time to accepted output, abandonment during generation, regeneration rate, and visible quality after waiting.
The shared number is accepted-output latency. That is where latency stops being an infrastructure metric and becomes a product metric. I would not let either side own it alone.
What provider incident should trigger a status-page update?
A status update is justified when users see sustained degradation, not just when a provider admits an outage. For media inference, that means rising queue delay, repeated timeouts, failed webhooks, regional degradation, missing output URLs, sharp fallback spikes, or accepted-output latency breaching the published threshold for a meaningful window.
One failed job is not a status-page event. A pattern is. The incident note should name the affected modality, region, route, and user-visible symptom. “Some generations are delayed” is better than silence. “Everything is operational” while video jobs sit in queue is worse than silence.
How should regional latency data be reviewed before expansion?
I review regional data by workload, not by geography alone. A region can look fine for text prompts and still be poor for image uploads. It can look fine for image generation and still be weak for video output delivery.
Before expansion, the review should compare P50, P95, timeout rate, upload time, queue delay, and accepted-output latency for each major workload. That includes image API latency tests with reference uploads, video API latency tests with real duration and resolution settings, and at least one mixed media workflow that calls more than one model.
The decision should also include retry cost, fallback quality, data residency limits, and support coverage during local peak hours. A region is not ready because the first test passed. It is ready when the slow cases are understood.
Conclusion
The useful media API comparison is not a leaderboard. It is a working map of where time goes: request, queue, model execution, post-processing, delivery, review, retry, and fallback.
For media inference, I would not publish a provider claim without the workload details beside it. Image, video, audio, and LLM calls do not share the same latency shape. A single average hides the parts that break user flow.
Measure accepted-output latency. Keep P95 visible. Track timeout and retry cost. Separate draft routes from final routes. Re-run the test after model updates, region changes, provider incidents, and pricing changes. That is the version of latency in an ai api that survives contact with production. To be verified again next month.
Previous posts: